Quality to Its Finest: Testing a Terminal-Styled CV Website
A personal website is your public face. If it breaks, everyone sees it. If it's inaccessible, people get locked out. But quality is more than "it doesn't crash" — it's about the experience. Testing isn't optional — it's how you prove you care.
Quality Is Experience
Before talking about test suites and coverage numbers, let me be clear about what "quality" means here. It's not just about catching bugs. It's about taste — the deliberate choices that make a website feel crafted rather than assembled.
This site is designed to feel good from the first millisecond:
- First connection setup: the site detects your OS (macOS/Windows/Linux) and system color preference (dark/light), applies both before the first paint — no flash of wrong theme
- Accent color palette: right-click the theme button to pick your accent color from 8 curated palettes. Your choice persists across sessions. Each palette is hand-tuned for both dark and light modes — no muddy grays, only black/white contrast
- Sidebar width: drag to resize, it remembers your preference in localStorage
- Theme persistence: dark/light mode, high contrast, accent color, OS style — all saved, all restored instantly on reload
- Consent-gated analytics: Vercel Web Analytics loads only after explicit opt-in. No tracking without permission. Your choice persists
- Keyboard-first design: every feature is reachable via keyboard.
?for help,[and]to focus sidebar/content,Ctrl+Kfor search, arrows to navigate, Enter to select, Escape to dismiss - Affordance on menu items: TOC items pulse on ready, headings highlight on scroll sync, copy buttons appear on hover/focus — the UI communicates what's interactive
- Screen-reader ready: skip-to-content link, ARIA roles on every interactive region,
aria-labelon every button, live regions for dynamic content, welcome message for assistive technology
These aren't features you test with expect(x).toBe(y). They're taste decisions verified by using the site, by feeling whether the fade transition is 80ms or 200ms, by noticing whether the scroll spy tracks smoothly or jitters. The automated tests below verify these choices don't regress. But the choices themselves come from caring.
The Problem
This website is a JavaScript SPA that renders markdown into a terminal-themed interface. It has a TOC sidebar with cascading animations, a scroll spy that tracks 4 levels of headings, a search engine with weighted scoring, keyboard shortcuts, mermaid diagrams rendered as dual-theme SVGs, image/diagram fullscreen overlays with zoom and pan, a hire modal, 8 selectable accent color palettes, theme switching with localStorage persistence — and a static build that pre-renders everything for SEO.
Two rendering paths, one codebase, 149 interactive features. How do you make sure nothing is broken?
You test it. At every level. Against every theme. On every target.
The Testing Architecture

Six layers, each catching different classes of bugs:
- Unit tests catch logic errors in milliseconds — with enforced coverage gates
- Property-based tests generate thousands of random inputs to find edge cases
- E2E tests catch interaction bugs in a real browser
- Visual regression catches layout drift pixel-by-pixel across all themes
- Accessibility audits catch WCAG violations — including a contrast matrix across 8 accent colors x 3 modes
- Performance tests catch speed regressions
Layer 1: Unit Tests + Coverage (Vitest)
Extract, Then Test
You can't unit-test code trapped inside an IIFE. The first step was extracting pure logic into importable modules:
js/lib/
├── slugify.js          → URL slug generation + hierarchical nesting
├── frontmatter.js      → YAML parsing + description extraction
├── search-logic.js     → Weighted scoring + highlight wrapping
└── mermaid-config.js   → Theme configuration (synced with app-shared.js)
Dependency Injection for the Build Pipeline
The static site generator (build-static.js) does heavy I/O — reading files, writing HTML, spawning mermaid CLI processes. To unit-test it without touching the filesystem, every I/O function accepts an io interface:
// Production: real filesystem
const defaultIO = {
  readFile:  (p) => fs.readFileSync(p, 'utf8'),
  writeFile: (p, data) => fs.writeFileSync(p, data, 'utf8'),
  exists:    (p) => fs.existsSync(p),
  mkdir:     (p) => fs.mkdirSync(p, { recursive: true }),
  execAsync: (cmd, opts) => util.promisify(exec)(cmd, opts),
  // ...
};

// Tests: in-memory mock
function createMockIO(files = {}) {
  const store = { ...files };
  return {
    readFile:  (p) => store[norm(p)],
    writeFile: (p, data) => { store[norm(p)] = data; },
    exists:    (p) => norm(p) in store,
    execAsync: vi.fn().mockResolvedValue({ stdout: '' }),
    // ...
  };
}
This lets us test buildTemplate(), buildPage(), renderAllMermaidSvgs(), and even main() with a fully mocked filesystem — verifying the entire build pipeline without writing a single byte to disk.
Coverage Gates
V8 coverage is enforced via quality gates. If coverage drops, the build fails:
File               | % Stmts | % Branch | % Funcs | % Lines
js/lib/            |     100 |    98.68 |     100 |     100
scripts/           |     100 |    91.12 |     100 |     100
Unreachable code (the real I/O bindings, the require.main entry guard, a defensive terser fallback) is marked with /* v8 ignore */ — excluded from metrics, documented in-place.
235 Tests, Under 3 Seconds
| Suite | Tests | What |
|---|---|---|
| slugify.test.js | 16 | Slug generation, hierarchical nesting, edge cases |
| frontmatter.test.js | 13 | YAML parsing, arrays, CRLF, description extraction |
| search-score.test.js | 17 | Scoring weights, highlight wrapping, regex escaping |
| mermaid-config.test.js | 18 | Theme config, contrast enforcement, lib/app-shared sync |
| build-static.test.js | 80 | Pure functions: rewriteLinks, buildMetaTags, TOC, sitemap, marked renderer |
| build-static-io.test.js | 55 | I/O functions with mock filesystem: cleanDir, buildTemplate, buildPage, main() |
| property-based.test.js | 36 | fast-check invariants across all pure functions |
| Total | 235 | 100% stmts, 100% funcs, 100% lines |
Layer 2: Property-Based Testing (fast-check)
Example-based tests verify specific inputs. Property-based tests verify invariants — rules that must hold for any input. fast-check generates thousands of random strings, numbers, and structures:
describe('slugify (property-based)', () => {
  it('result is always lowercase', () => {
    fc.assert(fc.property(fc.string(), (s) => {
      expect(slugify(s)).toBe(slugify(s).toLowerCase());
    }));
  });

  it('result never starts or ends with a dash', () => {
    fc.assert(fc.property(fc.string({ minLength: 1 }), (s) => {
      const result = slugify(s);
      if (result.length > 0) {
        expect(result[0]).not.toBe('-');
        expect(result[result.length - 1]).not.toBe('-');
      }
    }));
  });

  it('is idempotent: slugify(slugify(s)) === slugify(s)', () => {
    fc.assert(fc.property(fc.string(), (s) => {
      expect(slugify(slugify(s))).toBe(slugify(s));
    }));
  });
});
Property-based tests found a real bug: slugify had 75% branch coverage because no example test hit the "orphaned h3 without parent h2" path. fast-check's random inputs exercised it, pushing branches to 100%.
36 property-based tests cover: slugify, buildHierarchicalSlug, escapeHtml, parseFrontmatter, extractDescription, matchScore, highlight, rewriteLinks, assetPrefix, pageSlugFromPath.
Layer 3: E2E Tests (Playwright)
54 Tests, 6 Parallel Workers
Playwright runs in headless Chromium with 6 parallel workers. Each test gets a fresh browser context — complete isolation:
| Spec file | Tests | What |
|---|---|---|
| navigation.spec.js | 6 | SPA swap, back/forward, deep links, F5 reload |
| scroll-spy.spec.js | 7 | Heading sync, h4 walk-up, URL hash, click highlight |
| search.spec.js | 5 | Ctrl+K, filter, arrow nav, Enter, Escape |
| theme.spec.js | 12 | Dark/light, persistence, mermaid swap, HC, accent palette |
| keyboard.spec.js | 5 | ?, [, ], Escape, disabled in inputs |
| hire-modal.spec.js | 4 | Open, focus, Escape, close button |
| overlays.spec.js | 6 | Fullscreen, zoom, pan, Escape, backdrop, close |
| copy-buttons.spec.js | 4 | Code copy, heading copy, TOC copy, revert |
| mobile.spec.js | 5 | Toggle, backdrop, auto-close, hidden default, visible button |
Layer 4: Visual Regression
Full-Page Baselines: Every Page, Every Theme, Every Device
Every page is captured as a full-page stitched screenshot — not just the viewport, but the entire scrollable content from top to bottom. These baselines are the single source of truth for how every page should look, tracked in git.
The Full-Page Capture Problem
The site uses a terminal-style layout: html and body are height: 100vh; overflow: hidden, with #app as a position: fixed container and #content as the only scrollable element. Playwright's fullPage: true alone captures nothing beyond the viewport — it measures body.scrollHeight, which is locked at viewport height.
The fix: a helper that temporarily removes clipping from the entire layout chain before capture:
async function expandForFullPage(page) {
  await page.evaluate(() => {
    const s = (el, props) => { if (el) Object.assign(el.style, props); };

    // Remove clipping: html → body → #terminal-bar (fixed) → #app (fixed) → #content
    s(document.documentElement, { overflow: 'visible', height: 'auto' });
    s(document.body,            { overflow: 'visible', height: 'auto' });
    s(document.getElementById('terminal-bar'), { position: 'static', width: '100%' });
    s(document.getElementById('app'),          { position: 'static', height: 'auto' });
    s(document.getElementById('content'),      { overflow: 'visible', height: 'auto', flex: 'none' });
    s(document.getElementById('sidebar'),      { overflow: 'visible', height: 'auto',
      position: 'sticky', top: '0', alignSelf: 'flex-start' });
  });
}
This removes every position: fixed, overflow: hidden, and height: 100vh in the chain. The sidebar becomes sticky (scrolls with the page but stays visible), and the terminal bar flows naturally at the top. After expansion, Playwright captures a single tall PNG of the entire page.
Desktop Matrix
Generated dynamically from sitemap.xml — every page in every theme:
for (const theme of themes) {
  for (const pagePath of pages) {
    test(`${pageSlug} [${theme.name}]`, async ({ page }) => {
      await applyTheme(page, theme);
      await expandForFullPage(page);
      await expect(page).toHaveScreenshot(
        `${pageSlug}--theme-${theme.name}.png`, { fullPage: true }
      );
    });
  }
}
Mobile Device Matrix
4 real-world viewports test responsive behavior across all themes:
| Device | Resolution | Why |
|---|---|---|
| iPhone SE | 375×667 | Smallest mainstream — catches tight layouts |
| iPhone 14 | 390×844 | Most common iOS viewport |
| Pixel 7 | 412×915 | Common Android mid-range |
| iPad Mini | 768×1024 | Tablet — tests the sidebar breakpoint boundary |
Each device × 4 themes × 3 representative pages = 48 mobile tests, all full-page.
Screenshot Naming Convention
Filenames encode exactly what was captured — page, device, and theme are immediately readable:
{page}--theme-{mode}[-hc]-chromium-win32.png
{page}--{device}--theme-{mode}[-hc]-chromium-win32.png
Examples:
content-about--theme-dark-chromium-win32.png— about page, dark theme, desktophome--iphone-14--theme-light-hc-chromium-win32.png— homepage, iPhone 14, light high-contrast
Baseline Management
Baselines are full-page PNGs stored in test/visual/pages.spec.js-snapshots/, tracked in git.
- Update all baselines:
npm run test:visual:update -- --workers=12 - Update one page:
npm run test:visual:update -- --grep="content-about" - Review baselines:
npm run work -- --reviewopens Playwright UI with expected/actual/diff side-by-side, accept or reject per image - Re-run failures only:
npm run work -- --test --suite=visual --last-failed - Concurrency: 12 parallel workers with
fullyParallel: true - Retries: 5 retries per test (browser flakiness)
- Tolerance: 1% pixel ratio, 0.2 color threshold per pixel
Test Summary
| Category | Tests |
|---|---|
| Desktop: 44 pages × 4 themes | 176 |
| Mobile: 3 pages × 4 devices × 4 themes | 48 |
| Components: sidebar, hire modal, search | 5 |
| Total visual tests | 229 |
Layer 5: Accessibility
121 Tests: Axe Scan + Contrast Matrix + ARIA
Axe Scan: All 44 Pages
Every page from the sitemap is scanned against WCAG 2.0 AA:
for (const pagePath of pages) {
  test(`no critical violations: ${slug(pagePath)}`, async ({ page }) => {
    const results = await new AxeBuilder({ page })
      .withTags(['wcag2a', 'wcag2aa'])
      .analyze();
    // ...
  });
}
Contrast Matrix: 8 Accents x 3 Modes x 3 Pages
The accent color palette means the site can render in 8 different color schemes. Each must pass WCAG AA contrast. The contrast matrix tests every combination:
| Accent | Dark | Light | Dark + HC |
|---|---|---|---|
| Green | test | test | test |
| Blue | test | test | test |
| Purple | test | test | test |
| Orange | test | test | test |
| Red | test | test | test |
| Cyan | test | test | test |
| Pink | test | test | test |
| Yellow | test | test | test |
Each cell tests 3 representative pages (homepage, blog, skills) — 72 contrast tests. Can be scaled to all 44 pages (704 tests) for thorough audits.
for (const mode of themeModes) {
  for (const accent of accentColors) {
    for (const pagePath of contrastPages) {
      test(`${pageSlug} [${mode.name}/${accent}]`, async ({ page }) => {
        // Set accent + mode via localStorage, reload, run axe color-contrast
      });
    }
  }
}
ARIA Role Assertions
5 structural checks verified on every run: TOC navigation role, modal dialog role, search input label, skip-to-content link, theme button labels.
Interactive A11y Workflow
The workflow menu lets you pick exactly which suite to run:
--- a11y: which suite? ---
  1  All a11y tests (axe + contrast + ARIA)
  2  Axe scan (all pages, default theme)
  3  Contrast matrix — sample (3 pages, ~72 tests)
  4  Contrast matrix — ALL pages (~700+ tests)
  5  ARIA roles only
Layer 6: Performance
5 tests measuring:
- Homepage DOM content loaded (< 2000ms)
- Full page load (< 4000ms)
- SPA navigation speed (< 500ms)
- Scroll spy sync latency (< 100ms)
- Total page weight (< 2MB)
DEV vs STATIC: Two Targets, Same Tests
The site has two rendering paths. The same tests run against both:
const target = process.env.TEST_TARGET || 'static';
const servers = {
  dev:    { command: 'npx serve . -p 3001', port: 3001 },
  static: { command: 'npx serve public -p 3000', port: 3000 },
};
This catches discrepancies between client-side and server-side rendering — slug mismatches, link rewrites, mermaid rendering differences.
Reports and Feedback Loop
Every Playwright run outputs three reports:
test-results/<runId>/
├── artifacts/      ← failure screenshots, traces
├── report/         ← interactive HTML report
└── results.json    ← machine-readable (for CI and automation)
The JSON report is parsed by the workflow to print a CLI summary:
  ── Results ──
  65 passed  7 failed

  Failures:
  ✗ Contrast — dark + orange > content-skills [dark/orange]
  ✗ Contrast — light + yellow > home [light/yellow]
This enables automated triage: read results.json, identify failing combos, fix the code, re-run.
What a Failure Looks Like
When a test fails, the Playwright HTML report gives you three layers of feedback — what failed, when it failed, and what it looked like — so you can diagnose without re-running anything.
1. The violation: the exact rule, severity, affected elements, and the assertion that caught it.
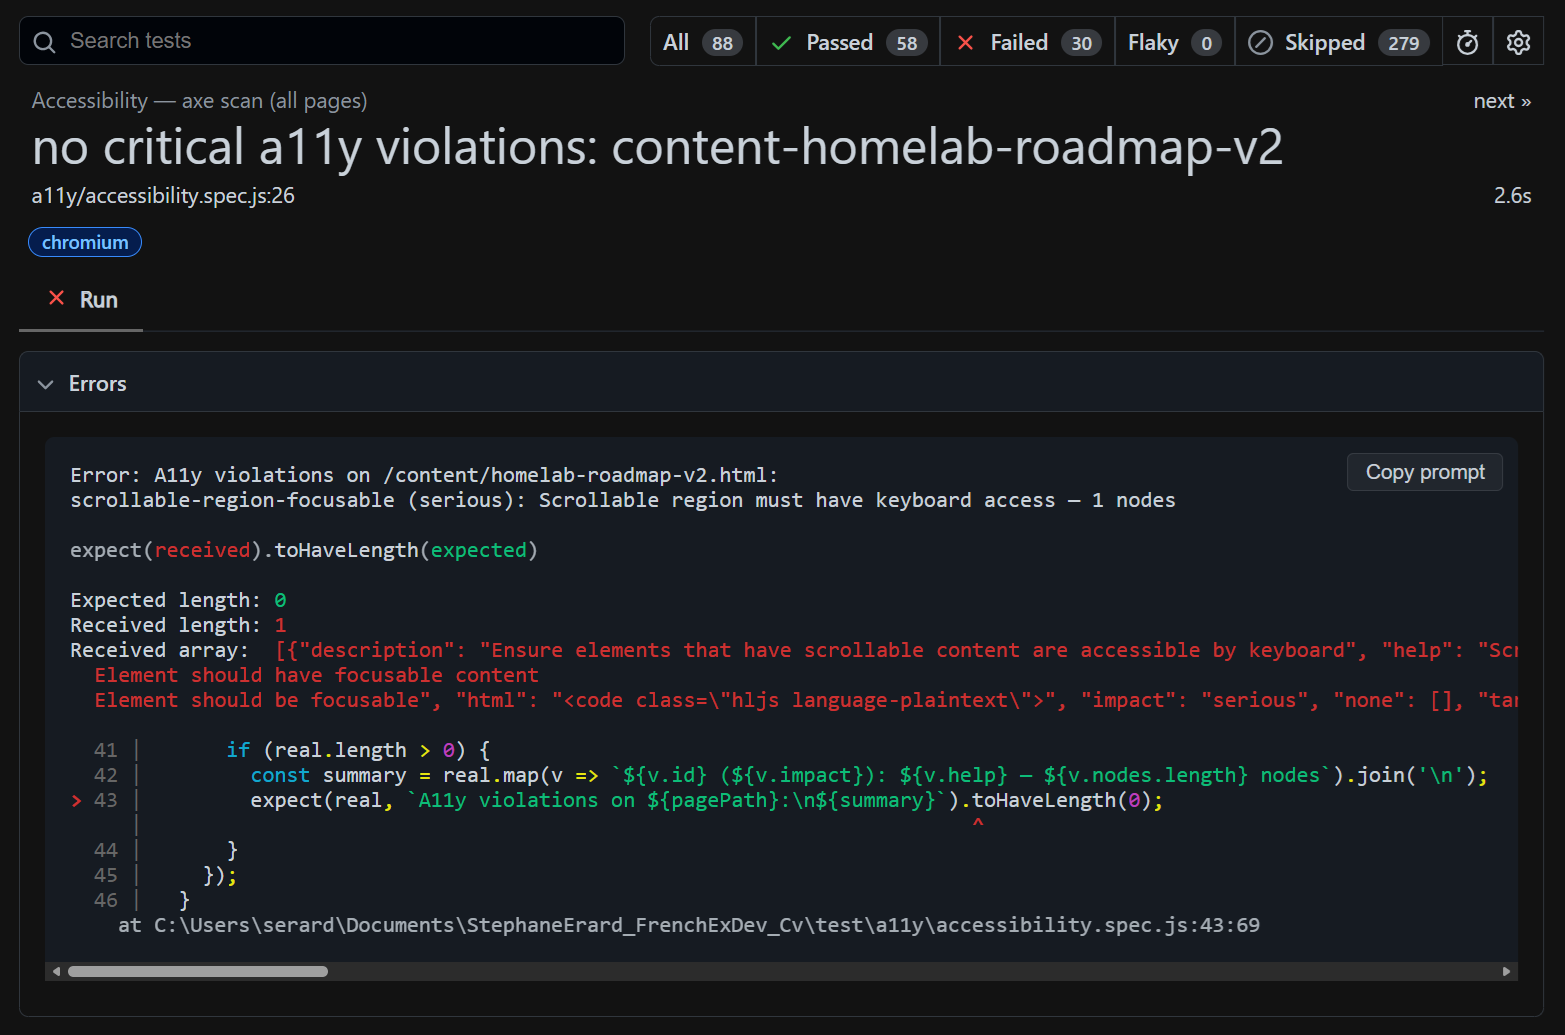
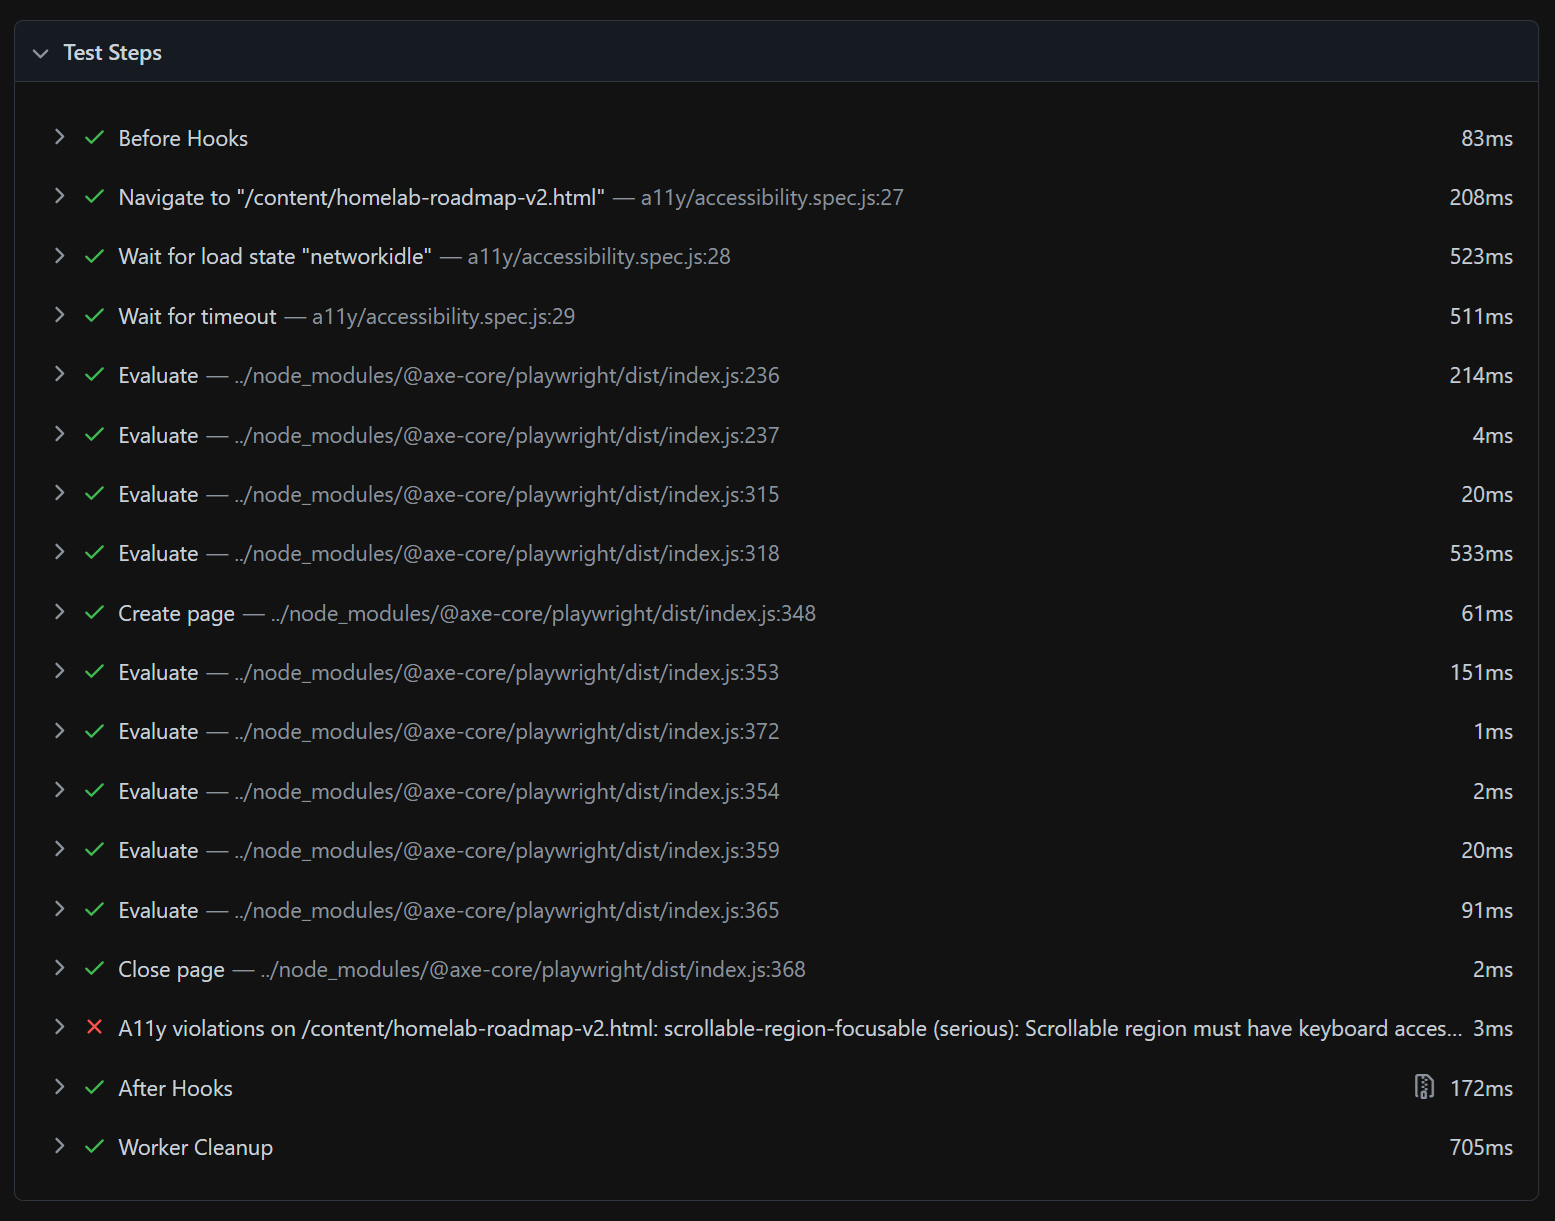
2. The timeline: every test step with its duration — navigate, wait, evaluate, close — so you see exactly where in the sequence the failure occurred.
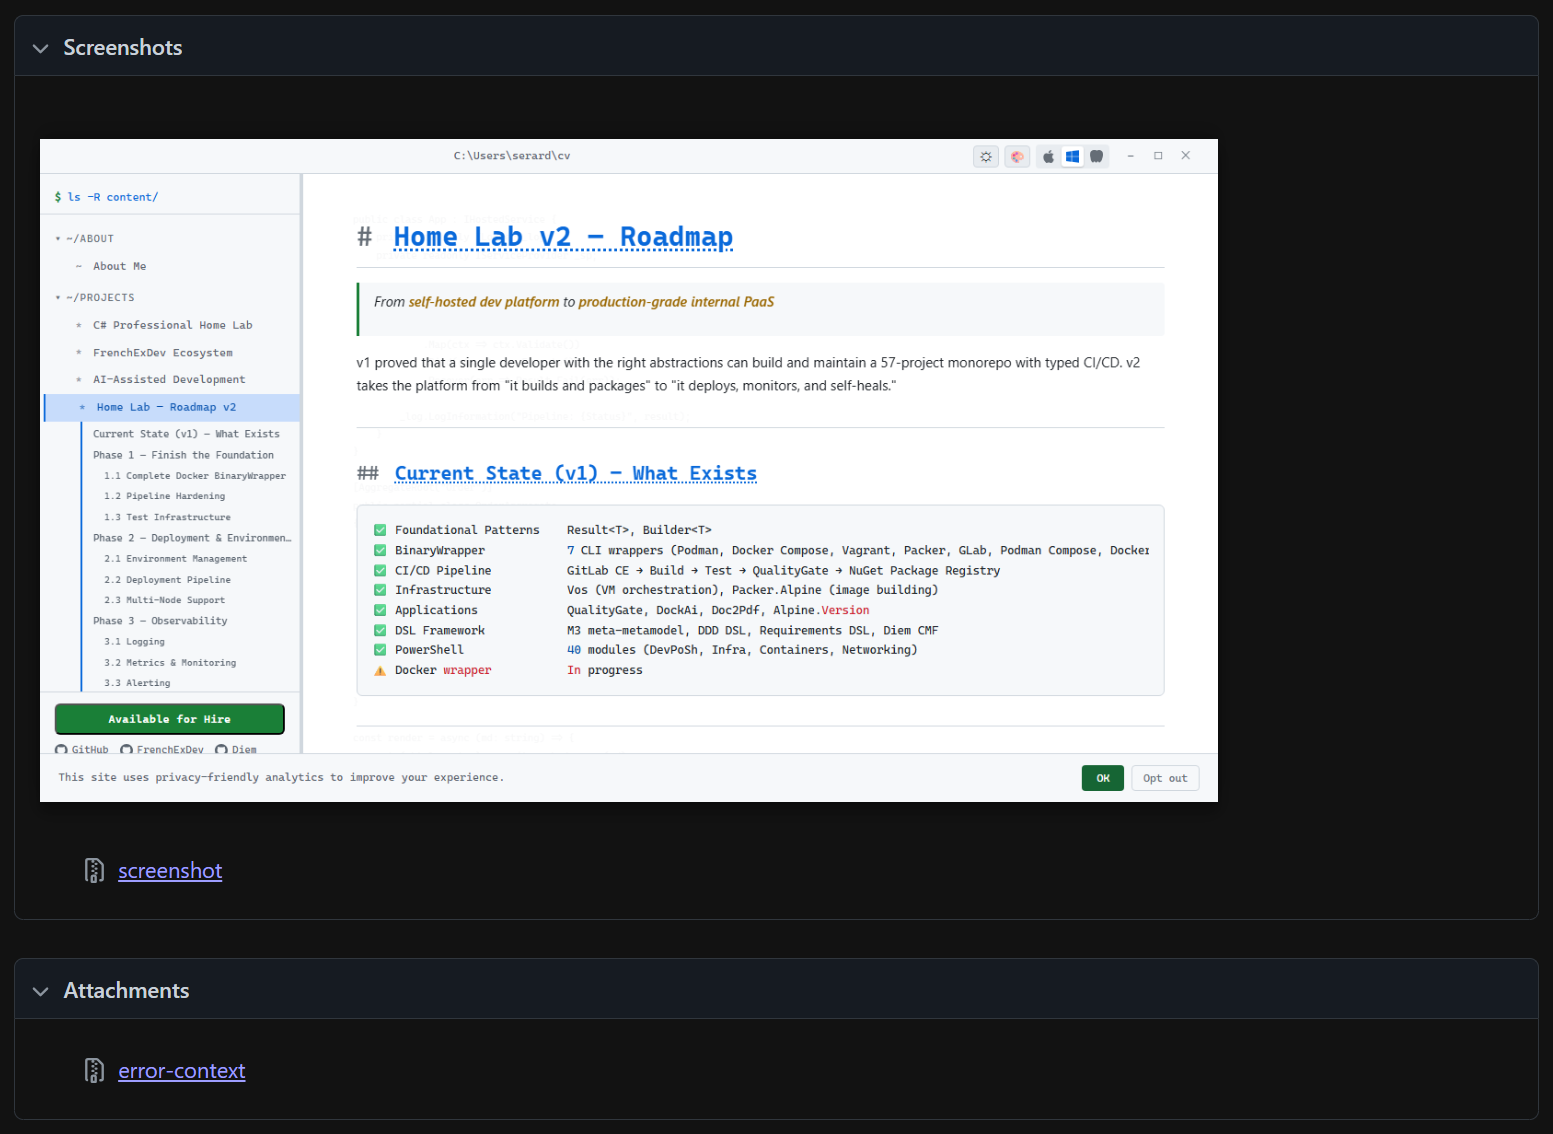
3. The screenshot: a capture of the page at the moment of failure — the actual rendered state the test saw, so you can visually inspect what went wrong.
This three-layer feedback — rule → timeline → visual proof — means you never have to guess. You see the violation, understand the sequence, and inspect the visual state. For the contrast matrix (8 accents × 3 modes × pages), this turns hundreds of potential color issues into actionable, screenshot-backed reports.
The Workflow
All testing is integrated into an interactive CLI (npm run work, press x):
--- test: what? ---
  1  Unit tests + coverage (Vitest)
  2  E2E tests (Playwright)
  3  Visual regression (Playwright)
  4  Accessibility (axe-playwright)
  5  Performance (page load, SPA nav, scroll spy)
  6  All (unit + E2E + a11y + perf)
  7  Update visual baselines
Reports are served automatically after tests complete. Press Enter to close and return to the menu.
CLI Mode
npm run work -- --serve-static --menu                    # start server + menu
npm run work -- --test --suite=unit                      # unit + coverage
npm run work -- --test --suite=e2e --target=dev          # E2E on dev
npm run work -- --test --suite=a11y-contrast --target=static  # contrast matrix
npm run work -- --test --suite=a11y-contrast-all         # ALL pages contrast
npm run work -- --build-fast --test                      # build then test all
The Numbers
| Layer | Tests | Tool | Time |
|---|---|---|---|
| Unit + coverage | 235 | Vitest + V8 | ~2s |
| E2E | 54 | Playwright (6 workers) | ~30s |
| Visual regression | 229 | Playwright full-page screenshots | ~3 min |
| Accessibility | 121 | axe-playwright | ~5 min |
| Performance | 5 | Playwright metrics | ~15s |
| Total | 644 | ~10 min |
Coverage: 100% statements, 100% functions, 100% lines on all tested code. Quality gates enforced — the build fails if coverage drops.
Tools
| Tool | Purpose |
|---|---|
| Vitest | Unit tests, coverage gates, HTML reports |
| @vitest/coverage-v8 | V8 coverage with per-file thresholds |
| fast-check | Property-based / fuzzy testing |
| Playwright | E2E, visual regression, performance, a11y |
| @axe-core/playwright | WCAG audits inside Playwright |
| Lighthouse | SEO + performance scoring |
Lessons Learned
Quality is taste. Automated tests verify that choices don't regress. But the choices — 80ms fade duration, smooth scroll easing, pulse affordance on ready, accent color curation — come from caring about the experience. Tests are the immune system; taste is the DNA.
Extract before you test. You can't unit-test an IIFE. Extracting pure logic into importable modules improved the architecture as a side effect.
Inject before you mock. The build pipeline went from untestable (direct fs calls) to 100% covered by accepting an io interface. Same pattern as C# dependency injection — the test provides a fake, production provides the real thing.
Property-based tests find what examples miss. fast-check found the orphaned h3 branch in slugify that no hand-written test covered. 36 property tests generate thousands of random inputs per run.
Test the matrix, not just the default. 8 accent colors x 3 modes x 44 pages = 1,056 possible contrast situations. Testing only the default theme misses 99.7% of them. The contrast matrix catches palette colors that look fine in dark mode but fail WCAG AA in light.
Machine-readable output enables automation. JSON reports let the CI (or Claude) read test results, identify failing combos, and suggest fixes — closing the loop between testing and action.